Fig. 7
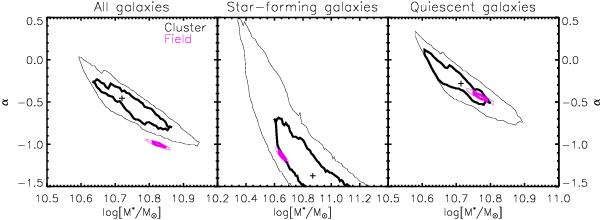
68% and 95% likelihood contours for the Schechter parameters M∗ and α, after marginalising over the φ∗ parameter. Black lines show the cluster contours, while magenta lines show the contours for the field data. +-signs show the single best fit Schechter parameters. The regions corresponding to the cluster SMF were obtained using maximum-likelihood fitting of the Monte-Carlo simulated data.
Current usage metrics show cumulative count of Article Views (full-text article views including HTML views, PDF and ePub downloads, according to the available data) and Abstracts Views on Vision4Press platform.
Data correspond to usage on the plateform after 2015. The current usage metrics is available 48-96 hours after online publication and is updated daily on week days.
Initial download of the metrics may take a while.