Fig. 5
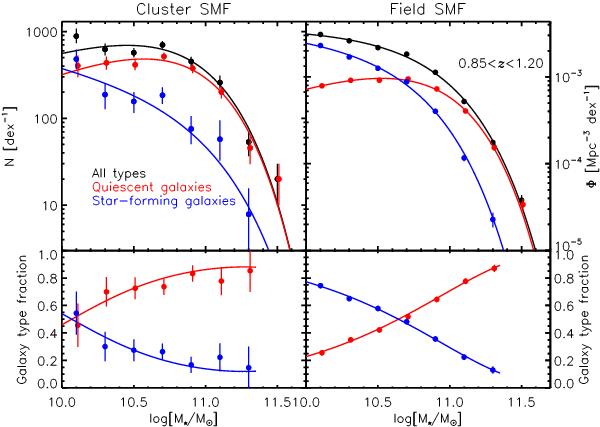
Comparing the cluster SMF (left panel) with a similar representation of the field SMF (right panel). The total SMFs (black points) are separated by galaxy type. Red points show the quiescent galaxies and the blue points show star-forming galaxies. The best-fitting Schechter functions are overplotted for each SMF sample. Note that the red points have been offset by 0.01 dex for better visibility. In the bottom panel we show the fractional contribution of quiescent and star-forming galaxies to the total population, and the curves show the fractional contributions of the Schechter functions. The relative contribution of quiescent galaxies is shown to be higher in the cluster than in the field. Note that the error bars on the field data are smaller than the data point symbols, because only Poissonian errors are taken into account.
Current usage metrics show cumulative count of Article Views (full-text article views including HTML views, PDF and ePub downloads, according to the available data) and Abstracts Views on Vision4Press platform.
Data correspond to usage on the plateform after 2015. The current usage metrics is available 48-96 hours after online publication and is updated daily on week days.
Initial download of the metrics may take a while.