Fig. B.1
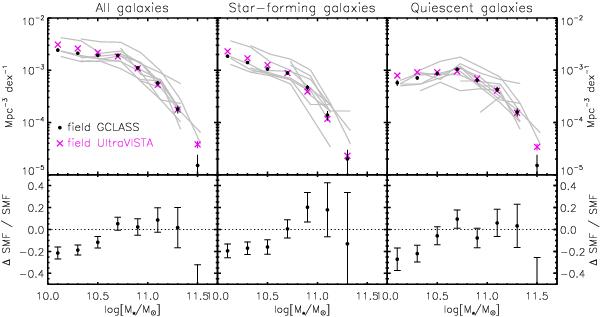
UltraVISTA (magenta) versus GCLASS (black) field measurements. Left panel: total galaxy population in both fields. Middle panel: SMF for the sub-set of star-forming galaxies. Right panel: sub-set of quiescent galaxies. Error bars show the 68% confidence regions for Poisson error bars. The grey curves show the 10 contributions to the field SMF around the GCLASS clusters, which differ because of cosmic variance due to the small volumes probed in these individual fields. Also the fields contribute only down to a particular mass respecting the varying depths of the GCLASS fields. Bottom panels: fractional differences between the two field measurements, given by  , together with the estimated errors.
Current usage metrics show cumulative count of Article Views (full-text article views including HTML views, PDF and ePub downloads, according to the available data) and Abstracts Views on Vision4Press platform.
Data correspond to usage on the plateform after 2015. The current usage metrics is available 48-96 hours after online publication and is updated daily on week days.
Initial download of the metrics may take a while.