Free Access
Fig. 1
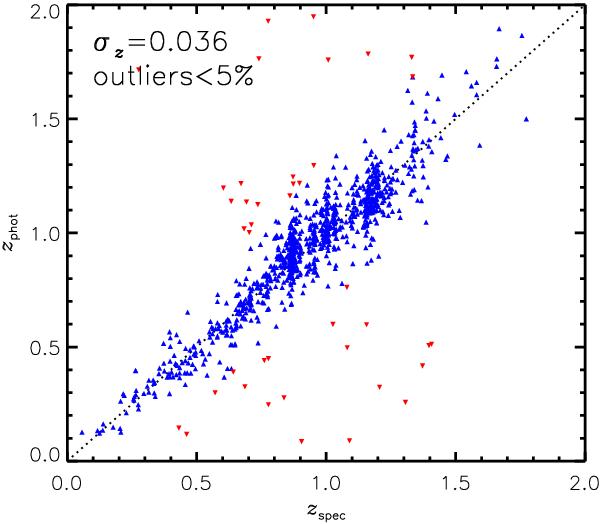
Spectroscopic versus photometric redshifts for the 10 GCLASS clusters. Outliers, objects for which Δz > 0.15, are marked in red. The outlier fraction is less than 5%, the scatter of the remaining objects is σz = 0.036.
Current usage metrics show cumulative count of Article Views (full-text article views including HTML views, PDF and ePub downloads, according to the available data) and Abstracts Views on Vision4Press platform.
Data correspond to usage on the plateform after 2015. The current usage metrics is available 48-96 hours after online publication and is updated daily on week days.
Initial download of the metrics may take a while.