Free Access
Fig. A.2
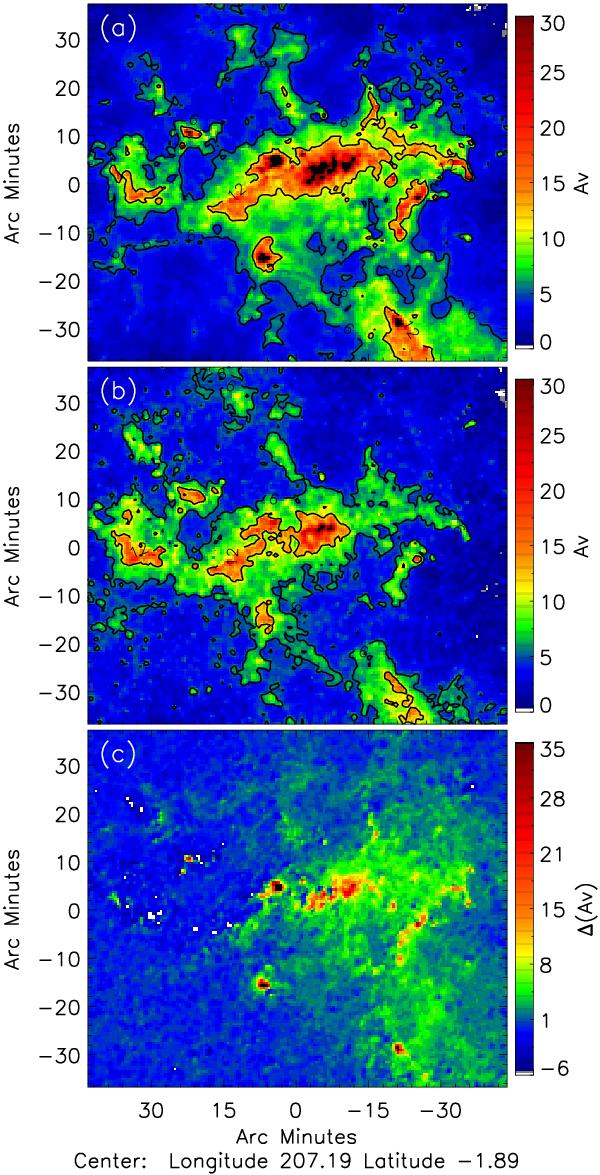
a) Extinction derived from dust emission using Herschel data. b) Extinction derived from UKIDSS H − Ks color excess. c) Difference between the two extinction map a)−b) . The color-map cuts are identical for a) and b) and set to display the visual extinction from 0 to 30 mag. Contours for AV = 6 and 12 mag are overlaid.
Current usage metrics show cumulative count of Article Views (full-text article views including HTML views, PDF and ePub downloads, according to the available data) and Abstracts Views on Vision4Press platform.
Data correspond to usage on the plateform after 2015. The current usage metrics is available 48-96 hours after online publication and is updated daily on week days.
Initial download of the metrics may take a while.