Fig. 7
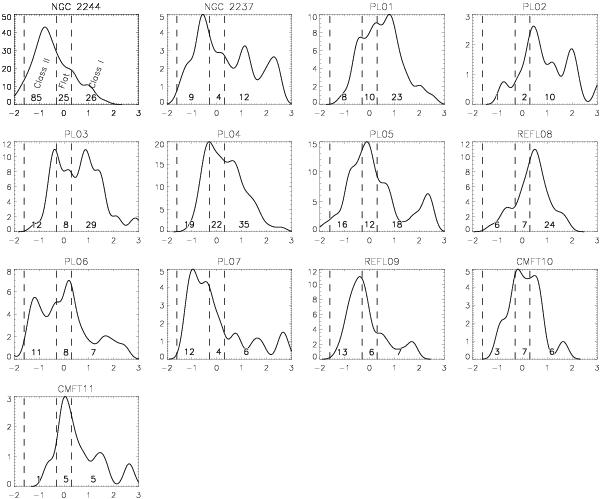
Density distribution of the spectral index α = dlog (λFλ)/dlog λ. The dashed lines define the Class II, Flat spectrum, and Class I source locations. The number of objects for these three classes is indicated for each cluster. The density distribution is obtained using the kernel estimator presented in Silverman (1986). It is particularly well adapted to small samples since it does not depend on the first bin position and is oversampled.
Current usage metrics show cumulative count of Article Views (full-text article views including HTML views, PDF and ePub downloads, according to the available data) and Abstracts Views on Vision4Press platform.
Data correspond to usage on the plateform after 2015. The current usage metrics is available 48-96 hours after online publication and is updated daily on week days.
Initial download of the metrics may take a while.