Fig. 1
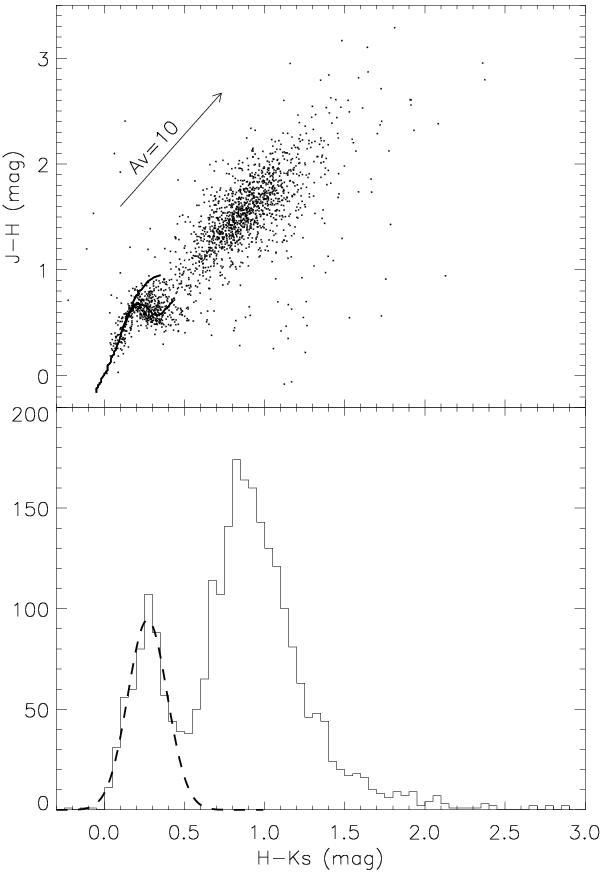
Top: color−color diagram for sources in the regions where AV > 10 mag, excluding the cluster areas. The two groups correspond to foreground and background stars. The arrow represents the reddening vector for 10 mag of visual extinction. Bottom: color histogram for the same sources. The dashed line is a Gaussian fit of the bluer peak, yielding a foreground star density of 2.2 ± 0.1 arcmin-2.
Current usage metrics show cumulative count of Article Views (full-text article views including HTML views, PDF and ePub downloads, according to the available data) and Abstracts Views on Vision4Press platform.
Data correspond to usage on the plateform after 2015. The current usage metrics is available 48-96 hours after online publication and is updated daily on week days.
Initial download of the metrics may take a while.