Fig. 7
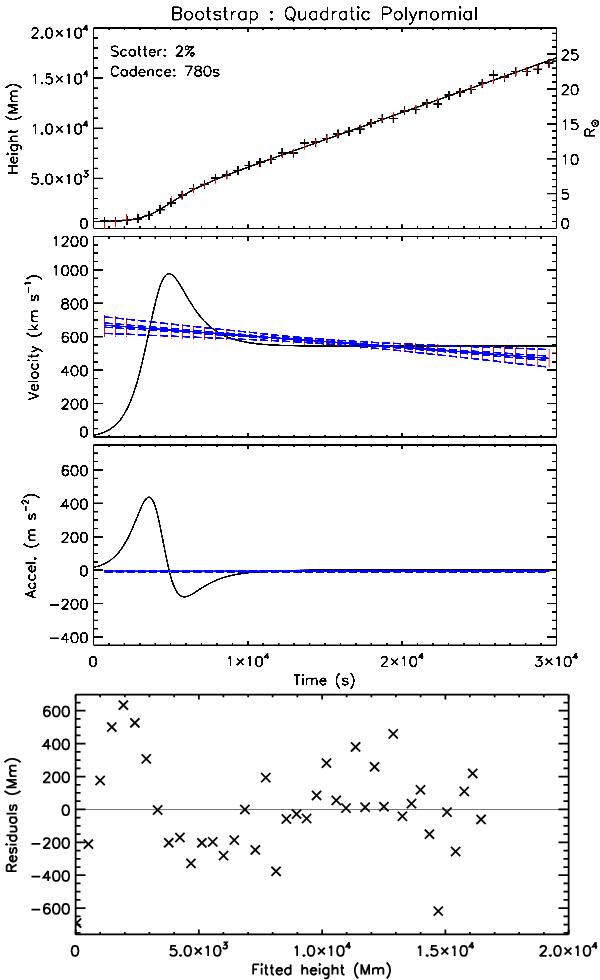
Bootstrapped second order polynomial fit to simulated CME height-time measurements, with 2% scatter and 780 s cadence. The panels from top to bottom show the height, velocity, and acceleration plots, and the residuals of the initial fitted height. The red points show the resampled residuals with replacement, and the blue dashed lines are the median, interquartiles range, and upper and lower fences on the bootstrapped fit. The quadratic form tends to smooth out the non-constant acceleration profile, as revealed by the trend in the residuals, indicating that the fit is not appropriate for the measurements.
Current usage metrics show cumulative count of Article Views (full-text article views including HTML views, PDF and ePub downloads, according to the available data) and Abstracts Views on Vision4Press platform.
Data correspond to usage on the plateform after 2015. The current usage metrics is available 48-96 hours after online publication and is updated daily on week days.
Initial download of the metrics may take a while.