Fig. 6
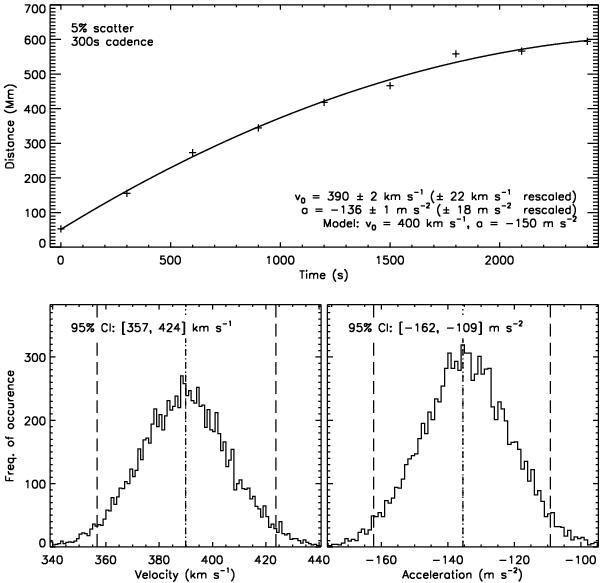
Top panel: initial fit of Eq. (2) to simulated coronal wave distance-time measurements, with 5% scatter and 300 s cadence. Errorbars of ±1.1 Mm are assigned to the measurements, based on the 1.5 arcsec resolution of the imager. The fit parameters are quoted with 1σ uncertainties, with the rescaled uncertainties shown in brackets. Bottom panels: histograms of the initial velocity and acceleration values derived using the bootstrapping technique. The mean and 95% confidence interval are indicated by the dot-dashed and dashed lines respectively. Bootstrapping provides a distribution of fitting parameters that is unattainable via a standard single-fit to data when unknown sources of uncertainty exist.
Current usage metrics show cumulative count of Article Views (full-text article views including HTML views, PDF and ePub downloads, according to the available data) and Abstracts Views on Vision4Press platform.
Data correspond to usage on the plateform after 2015. The current usage metrics is available 48-96 hours after online publication and is updated daily on week days.
Initial download of the metrics may take a while.