Fig. 5
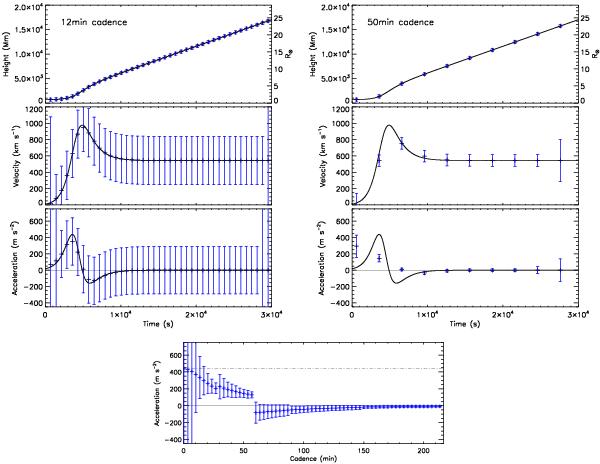
Demonstration of the effects of cadence on the error propagation according to the 3-point Lagrangian interpolation. A kinematic model for a CME with non-constant acceleration peaking at 437 m s-2 is tested for varying cadences, without any scatter. The top left plots show the height, velocity, and acceleration profiles for data sampled at 12 min cadence. The top right plots show the same data sampled at 50 min cadence. Note how the errorbars of the higher cadence measurements are counter-intuitively larger than the lower cadence measurements, even though the higher sampling rate better reveals the true kinematic trend. The bottom plot shows the derived peak acceleration against cadence, where the dot-dashed line indicates the true value of 437 m s-2. The errorbars are shown to reduce in magnitude (implying greater precision) even though the derived acceleration at lower cadence is less accurate.
Current usage metrics show cumulative count of Article Views (full-text article views including HTML views, PDF and ePub downloads, according to the available data) and Abstracts Views on Vision4Press platform.
Data correspond to usage on the plateform after 2015. The current usage metrics is available 48-96 hours after online publication and is updated daily on week days.
Initial download of the metrics may take a while.