Fig. 12
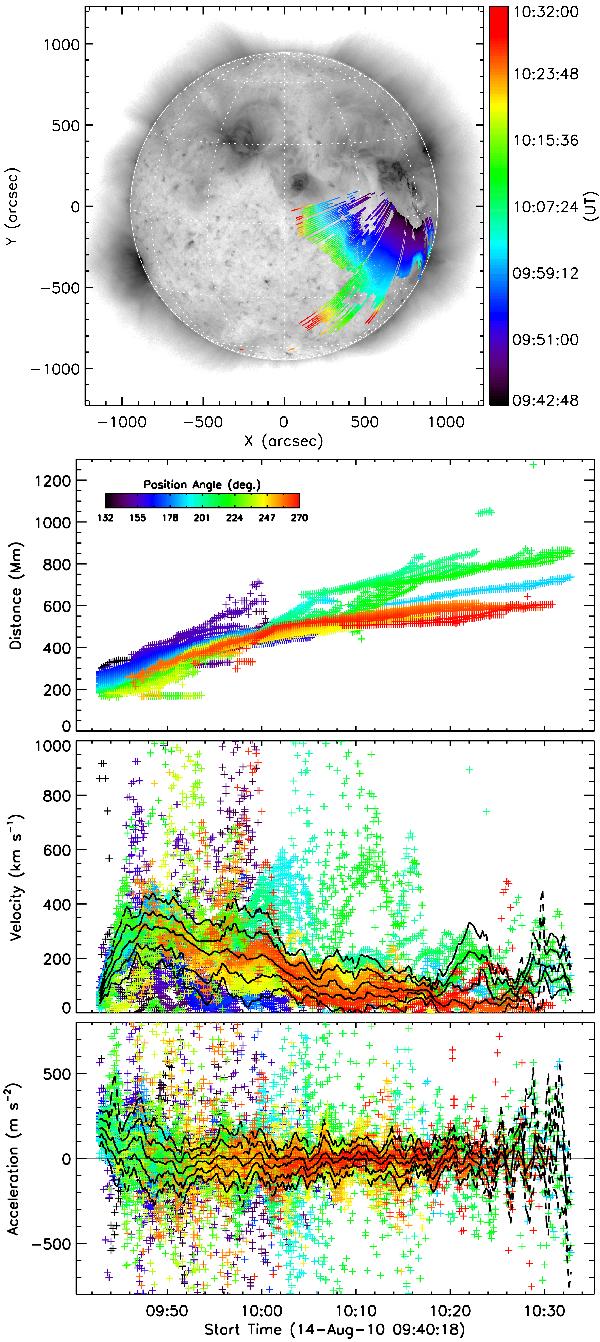
Savitzky-Golay filter applied to the automated CorPITA detection and tracking of a coronal wave observed by SDO/AIA on 2010 August 14. The top image shows a percentage base differenced frame during the event, with an overlay of the detected wave motion in time (indicated by the top right colourbar). The top plot of the lower panels shows the distance-time measurements across the angular range of the coronal wave (indicated by the inset colourbar). The middle and bottom plots show the derived velocity and acceleration profiles, with the median (solid line), interquartile range (inner dashed lines) and upper and lower fences (outer dashed lines) over-plotted.
Current usage metrics show cumulative count of Article Views (full-text article views including HTML views, PDF and ePub downloads, according to the available data) and Abstracts Views on Vision4Press platform.
Data correspond to usage on the plateform after 2015. The current usage metrics is available 48-96 hours after online publication and is updated daily on week days.
Initial download of the metrics may take a while.