Fig. 11
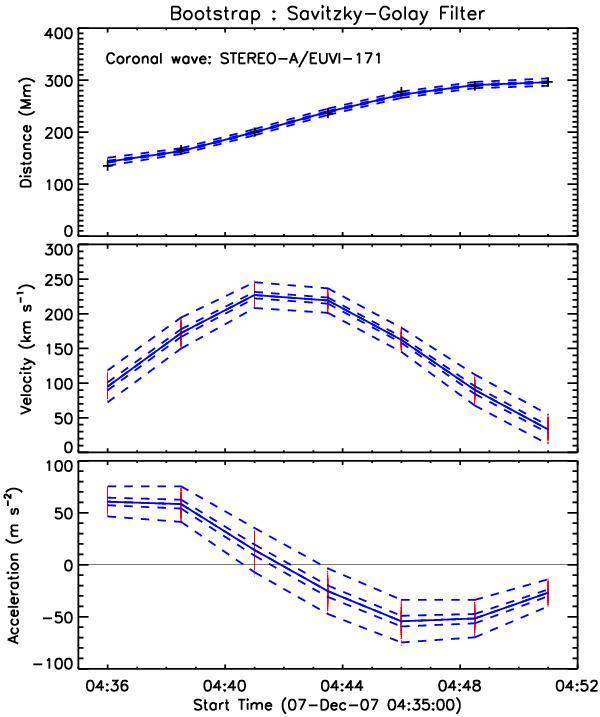
Bootstrapped Savitzky-Golay filter method applied to a coronal wave event observed by STEREO-Ahead/EUVI 171 Å on 2007 December 7, revisited from Long et al. (2011). The top plot shows the distance-time measurements (plus symbols), the resampled residuals (red points), and the median (solid line), interquartile range (inner dashed lines), and upper and lower fences (outer dashed lines). The middle and bottom plots show the corresponding velocity and acceleration profiles.
Current usage metrics show cumulative count of Article Views (full-text article views including HTML views, PDF and ePub downloads, according to the available data) and Abstracts Views on Vision4Press platform.
Data correspond to usage on the plateform after 2015. The current usage metrics is available 48-96 hours after online publication and is updated daily on week days.
Initial download of the metrics may take a while.