Fig. 1
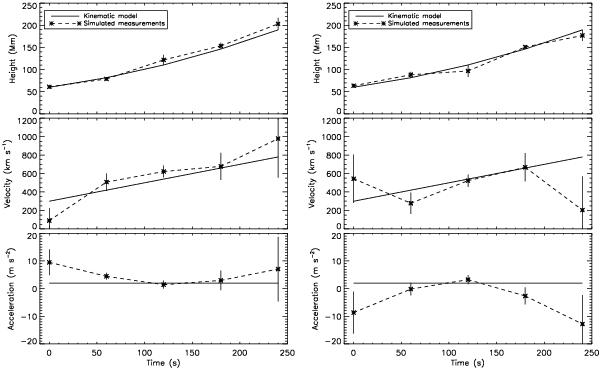
Kinematic model for a CME with constant acceleration 2 m s-2 and initial velocity 300 km s-1, and two data simulations of how the resulting profiles for different scatters on the height-time measurements (top panels) behave when 3-point Lagrangian interpolation is used to derive the velocities (middle panels) and accelerations (bottom panels). Both simulated cases were produced by adding scatter to the height measurements, via a normally-distributed random number generator with a standard deviation of 10% of the model height at each time-step. The different instances of scatter shown here produce completely opposing trends in the accelerations, with the errorbars failing to appropriately overlap the model, therefore belying the true trend.
Current usage metrics show cumulative count of Article Views (full-text article views including HTML views, PDF and ePub downloads, according to the available data) and Abstracts Views on Vision4Press platform.
Data correspond to usage on the plateform after 2015. The current usage metrics is available 48-96 hours after online publication and is updated daily on week days.
Initial download of the metrics may take a while.