Fig. 5
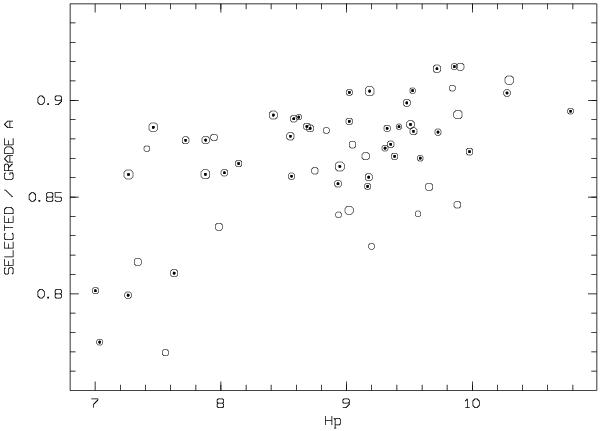
Ratio of selected to all grade-A measurements as a function of Hipparcos magnitude Hp. The area of the “°” symbols is proportional to the size of the grade-A samples (varying between 352 and 1048). Small dots in the symbols indicate the samples with less than 14% of the observations obtained before March 2002.
Current usage metrics show cumulative count of Article Views (full-text article views including HTML views, PDF and ePub downloads, according to the available data) and Abstracts Views on Vision4Press platform.
Data correspond to usage on the plateform after 2015. The current usage metrics is available 48-96 hours after online publication and is updated daily on week days.
Initial download of the metrics may take a while.