Fig. 2
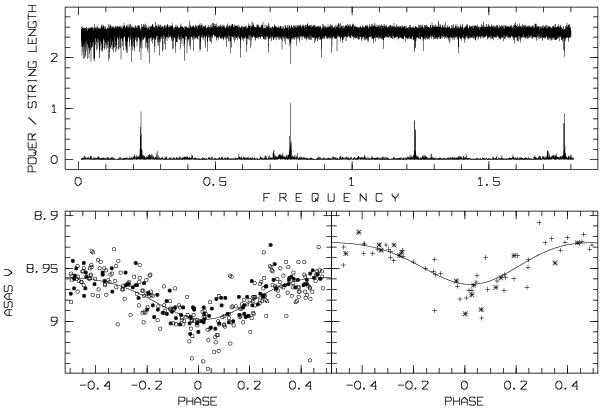
Same as Fig. 1 but for the two new-catalogue data sets of HD 46057. The data corresponding to the same time interval as the old-catalogue data are shown as filled discs in the lower left panel and plusses in the lower right panel. Two substantially fainter grade-A data points are not shown on the scale of the lower left panel. Both statistics in the upper panel are “normalised” to remove their dependence on the sample size.
Current usage metrics show cumulative count of Article Views (full-text article views including HTML views, PDF and ePub downloads, according to the available data) and Abstracts Views on Vision4Press platform.
Data correspond to usage on the plateform after 2015. The current usage metrics is available 48-96 hours after online publication and is updated daily on week days.
Initial download of the metrics may take a while.