Fig. 13
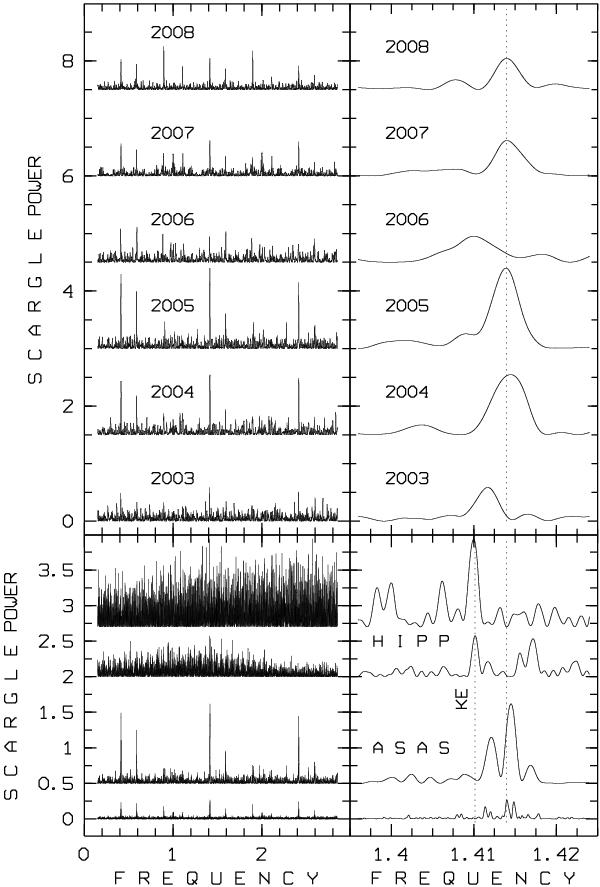
Scargle power diagrams for HD 119022. The lower panels show from bottom to top: the power in the whole (2001–2009) selected ASAS set, in the one restricted to all years except 2003, 2006 and 2009, in the complete Hipparcos data set, and in the 1991–1992 data with uncertainties of 0.013 mag and less, respectively. A long-term trend, shown as a full line in Fig. 12 was removed from the ASAS data. The upper panels show the power in the yearly ASAS data for any year with more than 50 data points. The dotted vertical lines in the zoom panels at the right-hand side indicate the frequency found by Koen & Eyer (2002), labeled “KE” and the frequency detected in the ASAS data from 2005.
Current usage metrics show cumulative count of Article Views (full-text article views including HTML views, PDF and ePub downloads, according to the available data) and Abstracts Views on Vision4Press platform.
Data correspond to usage on the plateform after 2015. The current usage metrics is available 48-96 hours after online publication and is updated daily on week days.
Initial download of the metrics may take a while.