Fig. 5
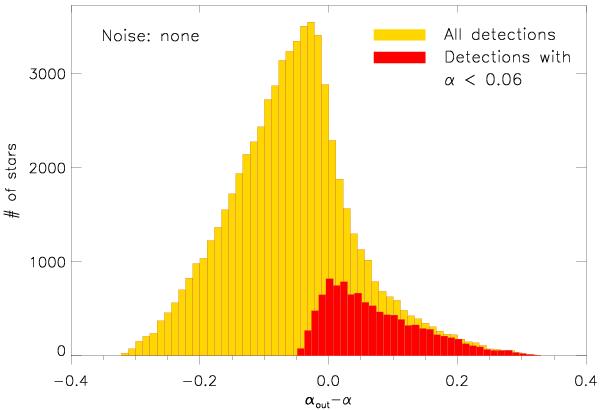
Distribution of αout − α for the noise-free case. It is centered at ⟨αout − α⟩ = −0.056 with a width of σ(α − αout) = 0.098. Comparing this plot with Fig. 4 shows that the total amount of DR is underestimated by 8.8% because αin ≤ α by definition. The detections where α < 0.06 are overplotted in red. Clearly, in these cases the detection of DR is difficult. In most cases, αout > α which demonstrates the limits of our method.
Current usage metrics show cumulative count of Article Views (full-text article views including HTML views, PDF and ePub downloads, according to the available data) and Abstracts Views on Vision4Press platform.
Data correspond to usage on the plateform after 2015. The current usage metrics is available 48-96 hours after online publication and is updated daily on week days.
Initial download of the metrics may take a while.