Fig. 7
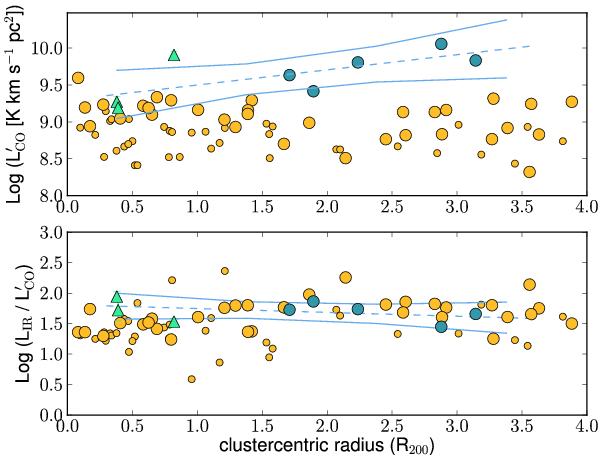
Upper panel: relation between the galaxy  and its projected location within the parent cluster expressed as a fraction of the cluster virial radius R200. The color code is the same as in Fig. 1. The larger orange symbols highlight the local galaxies with 2.5 × 10¹⁰ L⊙ ≤ LIR ≤ 1011 L⊙ (see text). Lower panel: the variation of the ratio between the IR and CO luminosities, taken respectively as proxy for star formation activity and cold gas reservoir, as a function of the distance to the cluster center. The error bars on the PdBI measurements are plotted on the y-axes; however, they are often smaller than the symbols. In both panels, the dashed line is the linear regression fit of the relations for the intermediate redshift cluster galaxies and the plain lines are the 95% confidence limits.
Current usage metrics show cumulative count of Article Views (full-text article views including HTML views, PDF and ePub downloads, according to the available data) and Abstracts Views on Vision4Press platform.
Data correspond to usage on the plateform after 2015. The current usage metrics is available 48-96 hours after online publication and is updated daily on week days.
Initial download of the metrics may take a while.