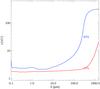
Fig. 4
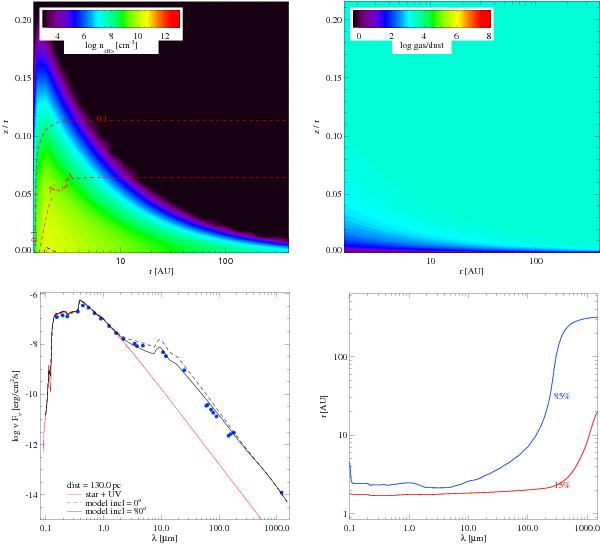
Disc gas density, gas-to-dust ratio, SED, and localization of the continuum emission for the fixed vertical structure disc model. The disc is gas-rich above the mid-plane and gas-poor in the mid-plane. For clarity a couple of observed photometric points are not shown in the SED. The lower-right panel shows the cumulative continuum emission for 15% and 85% for each wavelength. The continuum emission for wavelengths greater than 500 μm comes from the outer disc (R > 100 AU).
Current usage metrics show cumulative count of Article Views (full-text article views including HTML views, PDF and ePub downloads, according to the available data) and Abstracts Views on Vision4Press platform.
Data correspond to usage on the plateform after 2015. The current usage metrics is available 48-96 hours after online publication and is updated daily on week days.
Initial download of the metrics may take a while.