Free Access
Fig. 4
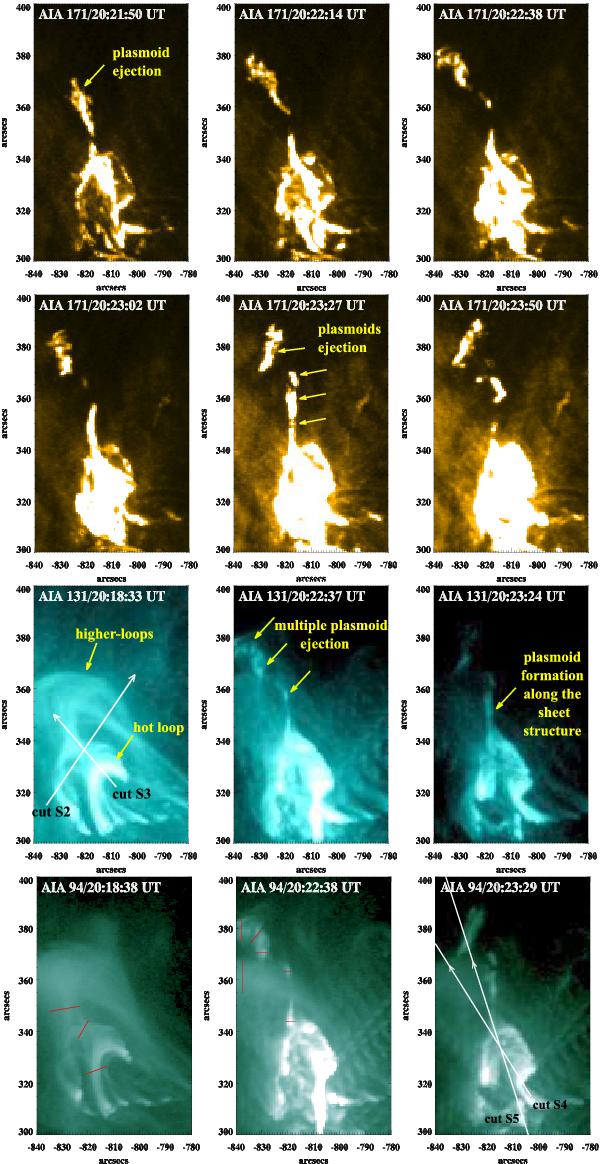
SDO/AIA EUV images at 171 (top two rows), 131 (middle), and 94 (bottom) Å showing multiple plasmoid ejections during the X-class flare on 3 November 2011. Red lines in the AIA 94 Å images (bottom) indicate the approximate thickness of the structures that is used for the density estimation.
Current usage metrics show cumulative count of Article Views (full-text article views including HTML views, PDF and ePub downloads, according to the available data) and Abstracts Views on Vision4Press platform.
Data correspond to usage on the plateform after 2015. The current usage metrics is available 48-96 hours after online publication and is updated daily on week days.
Initial download of the metrics may take a while.