Fig. 3
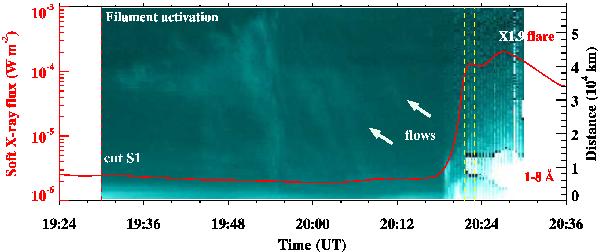
GOES soft X-ray flux profile in the 1–8 Å channel and space-time plot along slice “S1” of the AIA 131 Å images on 3 November 2011. A vertical red dotted line at ~19:30 UT, indicates the timing of filament activation and associated brightening. Two vertical dashed lines (yellow) indicate the timing of multiple plasmoid ejections during the impulsive phase of the flare. The timing of DPSs and plasmoid ejection is consistent with each other (see Fig. 1).
Current usage metrics show cumulative count of Article Views (full-text article views including HTML views, PDF and ePub downloads, according to the available data) and Abstracts Views on Vision4Press platform.
Data correspond to usage on the plateform after 2015. The current usage metrics is available 48-96 hours after online publication and is updated daily on week days.
Initial download of the metrics may take a while.