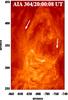
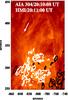
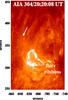
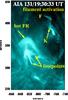
Fig. 2
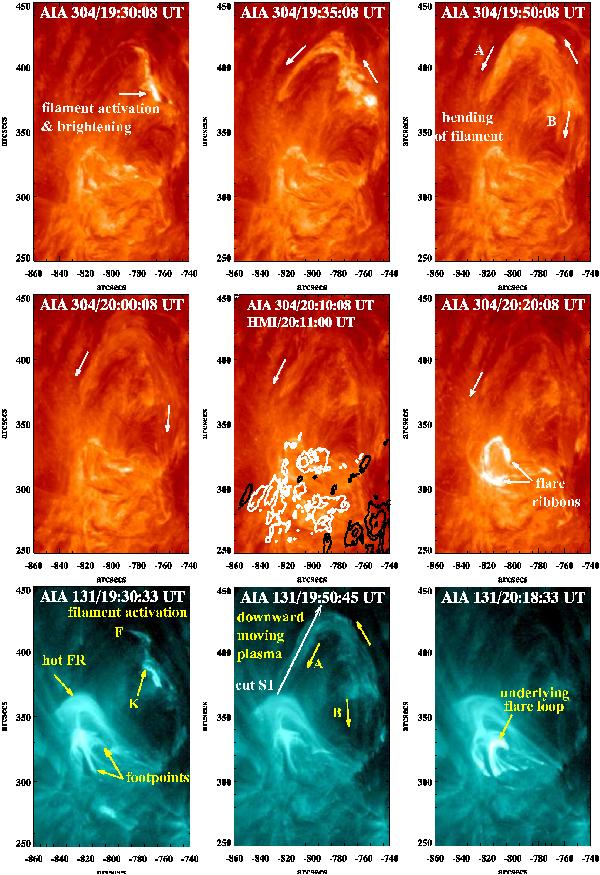
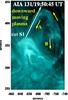
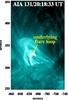
SDO/AIA EUV images at 304 Å (top and middle) and 131 Å (bottom) showing activation and bending of the filament toward the AR hot flux-rope structure on 3 November 2011. AIA 304 Å image at 20:10:08 UT is overlaid by the HMI magnetogram contours of positive (white) and negative (black) polarities. The contour levels are ±500, ±1000, and ±2000 G. The temporal evolution in the 304 Å and 131 Å bands over about one hour until the flare sets in can be found in a movie available in the online edition.
Current usage metrics show cumulative count of Article Views (full-text article views including HTML views, PDF and ePub downloads, according to the available data) and Abstracts Views on Vision4Press platform.
Data correspond to usage on the plateform after 2015. The current usage metrics is available 48-96 hours after online publication and is updated daily on week days.
Initial download of the metrics may take a while.