Free Access
Fig. 2
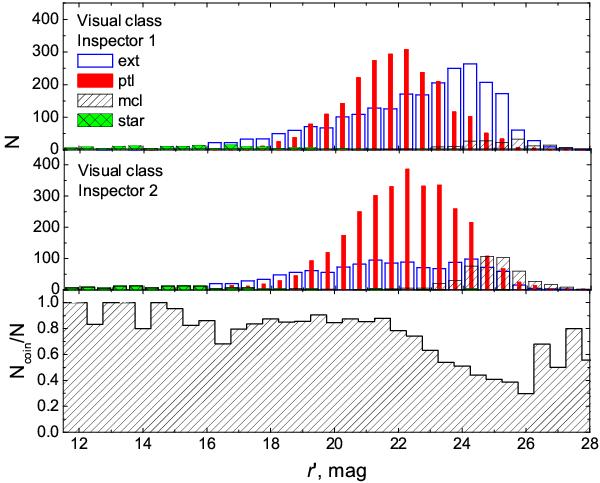
Magnitude distribution of 5142 visually classified objects by two independent inspectors (the top and middle panels). The fractional agreement between the two independent visual classifications is illustrated in the bottom panel.
Current usage metrics show cumulative count of Article Views (full-text article views including HTML views, PDF and ePub downloads, according to the available data) and Abstracts Views on Vision4Press platform.
Data correspond to usage on the plateform after 2015. The current usage metrics is available 48-96 hours after online publication and is updated daily on week days.
Initial download of the metrics may take a while.