Free Access
Fig. 15
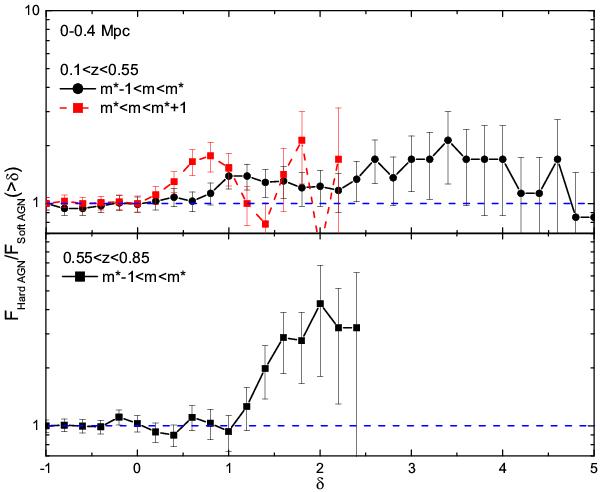
Ratio of the galaxy overdensity distributions of the hard and soft AGN samples for the 0−0.4 Mpc radial annulus for the fainter (red dashed line) and brighter (black continuous line) environments. Upper/lower panels correspond to the lower/higher z-range studied.
Current usage metrics show cumulative count of Article Views (full-text article views including HTML views, PDF and ePub downloads, according to the available data) and Abstracts Views on Vision4Press platform.
Data correspond to usage on the plateform after 2015. The current usage metrics is available 48-96 hours after online publication and is updated daily on week days.
Initial download of the metrics may take a while.