Free Access
Fig. 14
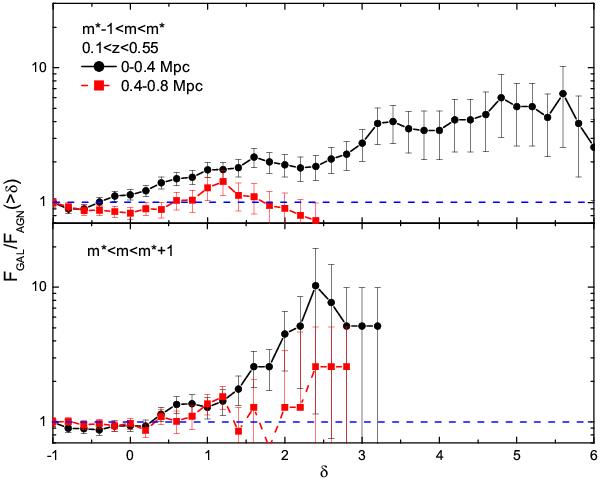
Ratio of the overdensity distributions of the GAL and AGN samples for both fainter (lower panel) and brighter (upper panel) environments. Black and red curves correspond to the 0−0.4 Mpc and 0.4−0.8 Mpc annuli, respectively.
Current usage metrics show cumulative count of Article Views (full-text article views including HTML views, PDF and ePub downloads, according to the available data) and Abstracts Views on Vision4Press platform.
Data correspond to usage on the plateform after 2015. The current usage metrics is available 48-96 hours after online publication and is updated daily on week days.
Initial download of the metrics may take a while.