Fig. 10
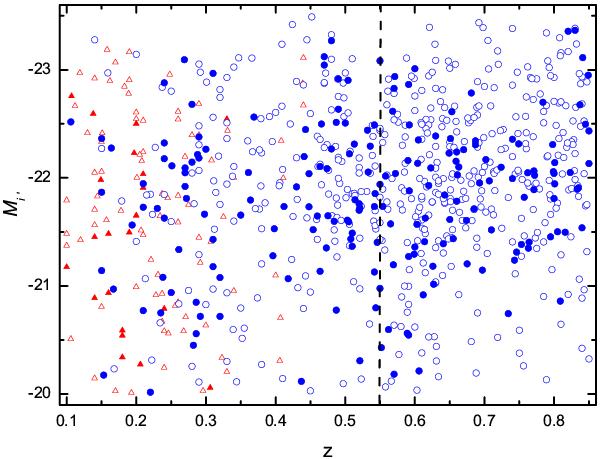
Diagram showing the absolute i′-band magnitude versus redshift for our final volume limited all sample. GALs are marked with triangles; AGN with circles. Soft (HR < −0.2) sources are shown with open symbols, and hard (HR ≥ −0.2) sources with filled symbols. The dashed line marks the separation between two chosen redshift ranges.
Current usage metrics show cumulative count of Article Views (full-text article views including HTML views, PDF and ePub downloads, according to the available data) and Abstracts Views on Vision4Press platform.
Data correspond to usage on the plateform after 2015. The current usage metrics is available 48-96 hours after online publication and is updated daily on week days.
Initial download of the metrics may take a while.