Fig. 7
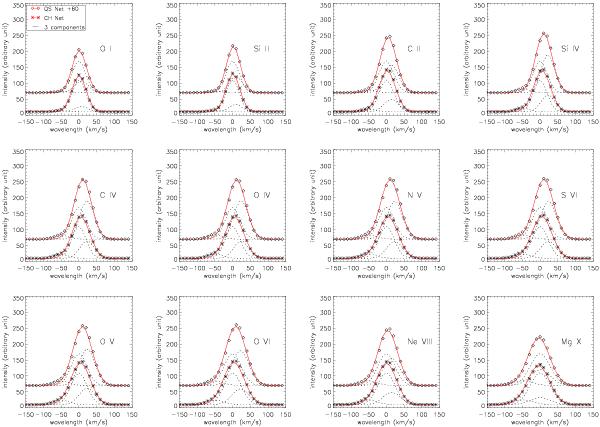
Artificial line profiles of ions with different formation temperature ranging from log (T/K) = 4.0 to log (T/K) = 6.1. The three emission components are shown as dotted lines, and the total profiles are shown as diamonds (QS network) and asterisks (CH network). Red lines are the single-Gaussian fitting profiles. The QS network profiles are shifted in the y-axis by 60 to avoid the overlap with CH profiles.
Current usage metrics show cumulative count of Article Views (full-text article views including HTML views, PDF and ePub downloads, according to the available data) and Abstracts Views on Vision4Press platform.
Data correspond to usage on the plateform after 2015. The current usage metrics is available 48-96 hours after online publication and is updated daily on week days.
Initial download of the metrics may take a while.