Fig. 6
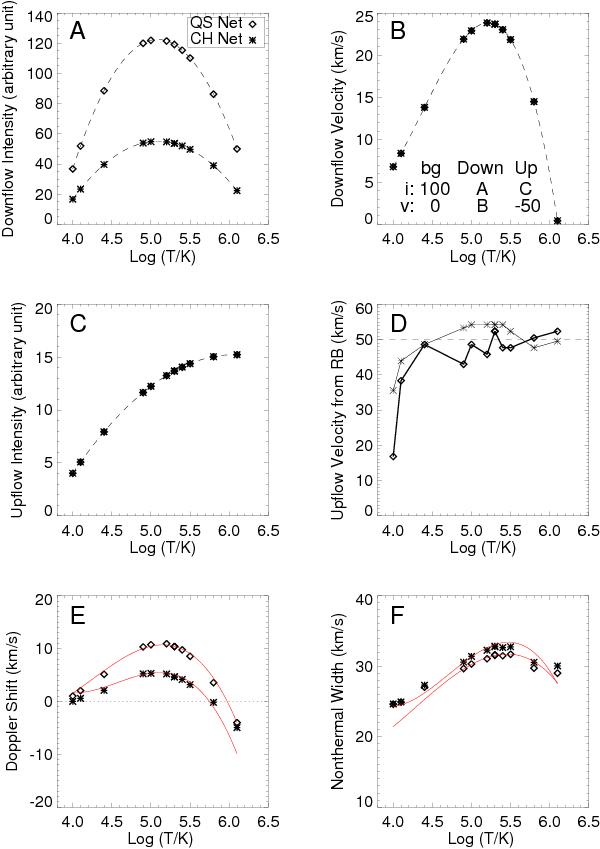
Input line parameters of the three emission components for the artificial line profiles and the results of RB asymmetry analysis and the output line parameters derived from single-Gaussian fit on the artificial profiles versus formation temperature, with diamonds for QS network and asterisks for CH network. A) Intensity of the downflow (cooling) component; B) velocity of the downflow component; C) intensity of the upflow (heating) component; D) upflow velocity derived from RBp asymmetry analysis; E)–F) Doppler-shift velocity and non-thermal line width determined from single-Gaussian fit. The dashed lines in A), B), and C) panels are the second-order polynomial fit of the input parameters. The red solid lines in panels E) and F) are adopted from the observational results discussed above (Figs. 4 and 5). In panel B), the other input parameters are noted. The background component, redshift component (cooling downflow), and blueshift component (heating upflow) are marked as “bg”, “down”, and “up”, respectively. The intensity and Doppler velocity are marked by “i” and “v”, respectively.
Current usage metrics show cumulative count of Article Views (full-text article views including HTML views, PDF and ePub downloads, according to the available data) and Abstracts Views on Vision4Press platform.
Data correspond to usage on the plateform after 2015. The current usage metrics is available 48-96 hours after online publication and is updated daily on week days.
Initial download of the metrics may take a while.