Fig. 3
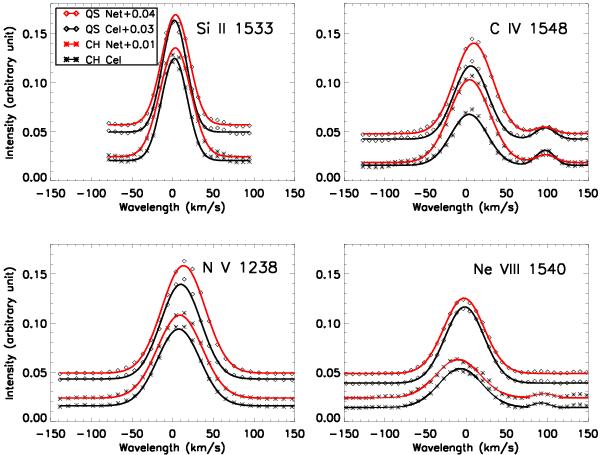
Normalized average line profiles of Si ii, C iv, N v, and Ne viii. The observed spectra in QS and CH are shown as the diamonds and asterisks. The solid lines are single-Gaussian (lefthand panels) or multi-Gaussian (righthand panels) fitting results in network (red) and internetwork regions (black). We shift the profiles in QS network, QS internetwork and CH network regions in the y-axis by 0.04, 0.03, and 0.01, respectively, to avoid the overlap between the different spectra.
Current usage metrics show cumulative count of Article Views (full-text article views including HTML views, PDF and ePub downloads, according to the available data) and Abstracts Views on Vision4Press platform.
Data correspond to usage on the plateform after 2015. The current usage metrics is available 48-96 hours after online publication and is updated daily on week days.
Initial download of the metrics may take a while.