Fig. 1
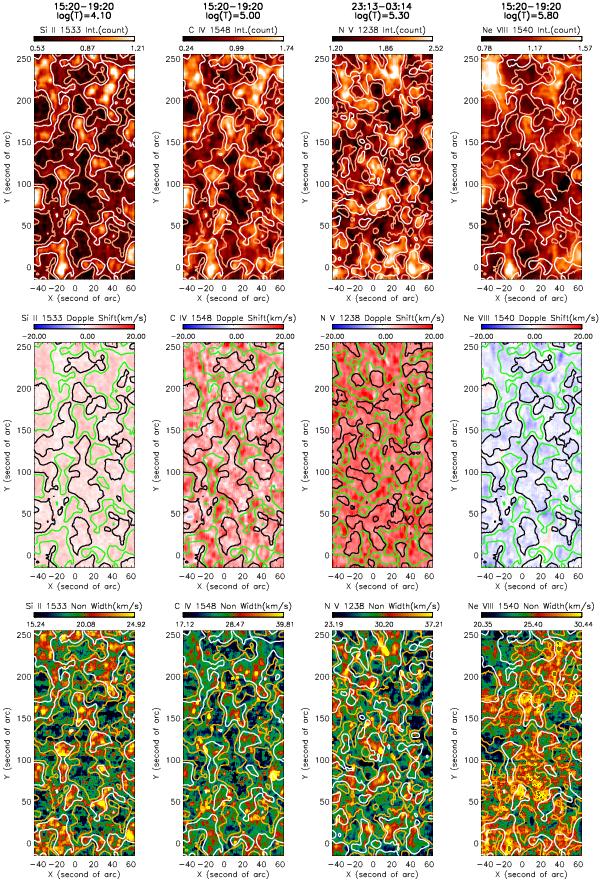
Spatial distribution of the parameters (line intensity, Doppler shift, and non-thermal width) derived from a Gaussian fit for Si ii, C iv, N v, and Ne viii in QS. The contours represent the network and internetwork regions as seen in the intensity map of Si II or continuum. The network regions are shown as white contours in the intensity and line-width maps, and as the green contours in the Doppler-shift maps. The internetwork regions are shown as brown, black, and orange contours in the maps of intensity, Doppler shift, and line width, respectively.
Current usage metrics show cumulative count of Article Views (full-text article views including HTML views, PDF and ePub downloads, according to the available data) and Abstracts Views on Vision4Press platform.
Data correspond to usage on the plateform after 2015. The current usage metrics is available 48-96 hours after online publication and is updated daily on week days.
Initial download of the metrics may take a while.