Fig. 12
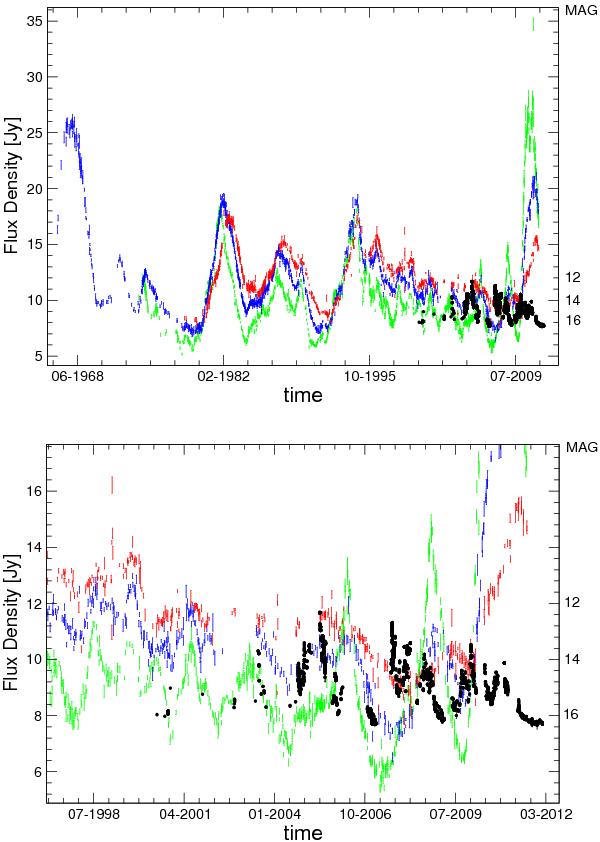
Flux density monitoring. The top panel shows the single-dish radio flux densities as observed within the Michigan monitoring program. Flux densities observed at 4.8 (red), 8.0 (blue), and 14.5 GHz (green) are shown. Superimposed is the R-band light-curve (black data points) obtained with the Abastumani optical telescope. Note that the two y-axes are labeled differently (the left y-axis describes the radio flux density, the right y-axis the optical magnitude). Please also note that the optical data cover the time between 2000 Jun. 03 and 2012 Feb. 02. The plot at the bottom is an expansion of the plot at the top.
Current usage metrics show cumulative count of Article Views (full-text article views including HTML views, PDF and ePub downloads, according to the available data) and Abstracts Views on Vision4Press platform.
Data correspond to usage on the plateform after 2015. The current usage metrics is available 48-96 hours after online publication and is updated daily on week days.
Initial download of the metrics may take a while.