Free Access
Fig. 11
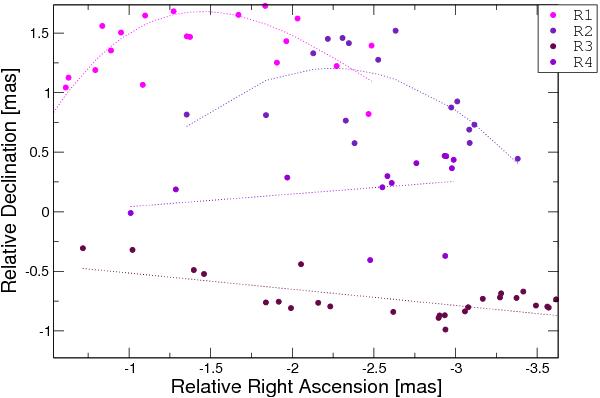
Coordinates of the arc-components R1, R2, R3, and R4. Dotted lines indicate a cubic regression model to R1, quadratic regression model to R2, and a linear regression model to R3 and R4. The fits are meant to visualize the trends, not to represent an optimum fit to the data.
Current usage metrics show cumulative count of Article Views (full-text article views including HTML views, PDF and ePub downloads, according to the available data) and Abstracts Views on Vision4Press platform.
Data correspond to usage on the plateform after 2015. The current usage metrics is available 48-96 hours after online publication and is updated daily on week days.
Initial download of the metrics may take a while.