Fig. 4
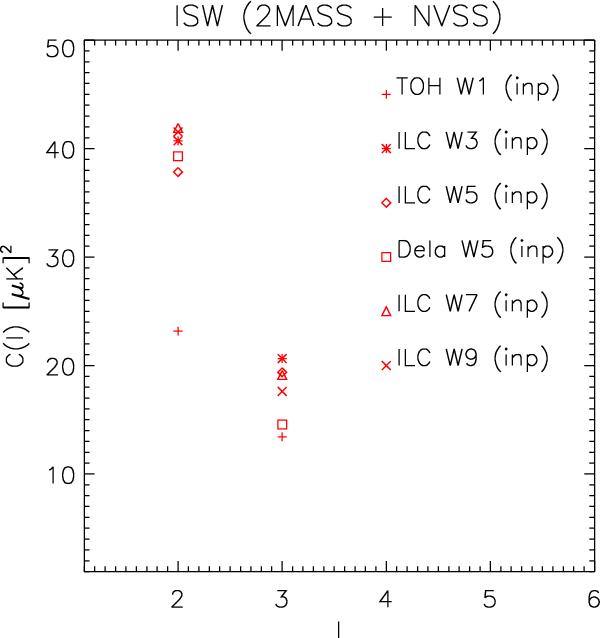
Quadrupole and octopole values (μK2) for the different reconstructed ISW maps. The ISW maps are reconstructed from sparsely inpainted CMB and LSS maps using Eq. (7), where the auto- and cross-correlations are measured directly from the data. Small variations in the phases of different renditions of CMB maps can lead to negligible differences in the auto-correlation (see Fig. 2) and to larger differences in a cross-correlation with a second map. This in turn can result in larger variations in the amplitude of the ISW signal, explaining why the reconstructed ISW maps vary slightly more between CMB maps than the observed temperature power does.
Current usage metrics show cumulative count of Article Views (full-text article views including HTML views, PDF and ePub downloads, according to the available data) and Abstracts Views on Vision4Press platform.
Data correspond to usage on the plateform after 2015. The current usage metrics is available 48-96 hours after online publication and is updated daily on week days.
Initial download of the metrics may take a while.