Free Access
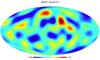
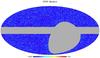
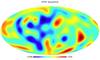
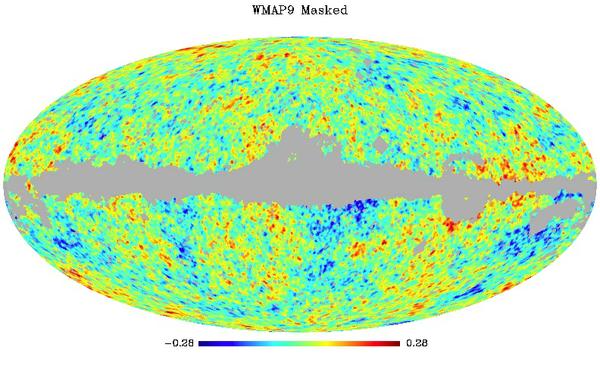
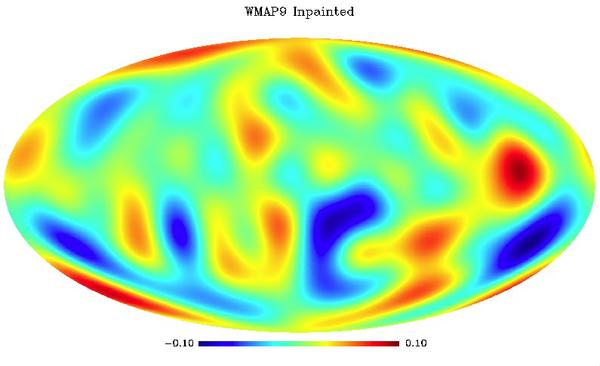
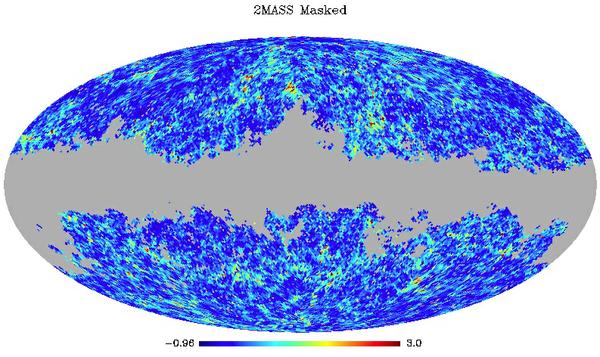
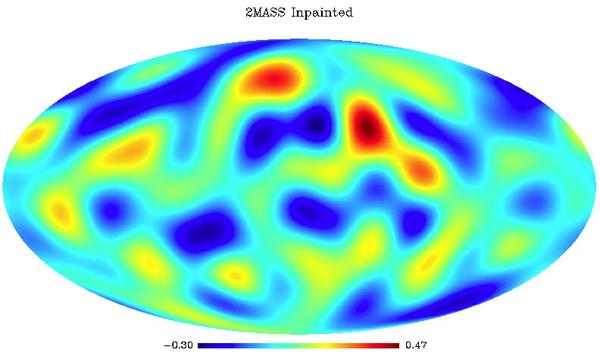
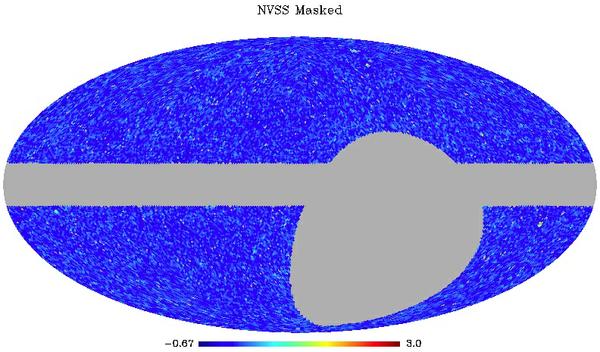
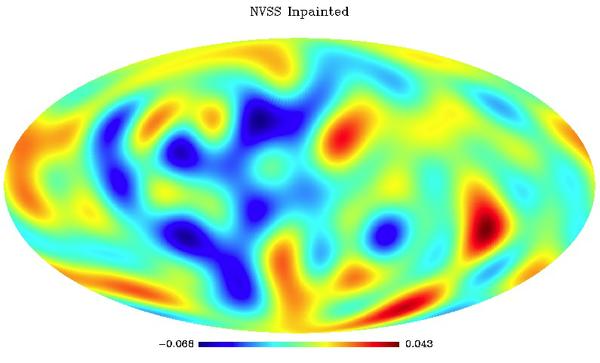
Fig. 1
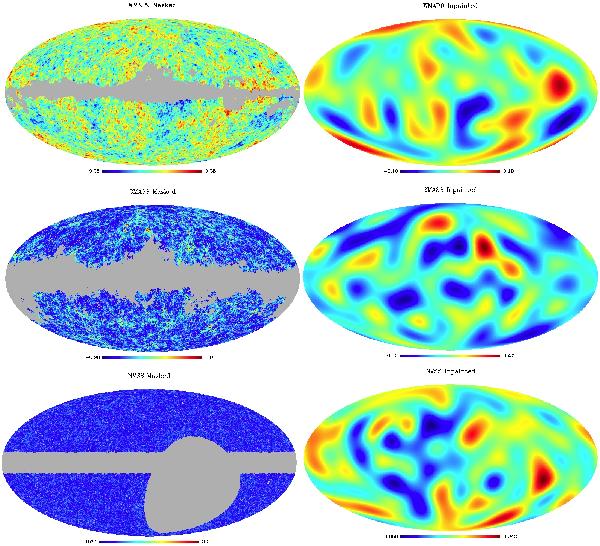
WMAP ILC 9th year CMB data (top in mK), 2MASS data (middle), and NVSS data (bottom) with mask (left) and after sparse inpainting (right). Data in the right column is presented up to ℓ = 10 for all maps. The original 2MASS data (middle left) is plotted with a maximum overdensity value of 3 to increase contrast in the map.
This figure is made of several images, please see below:
Current usage metrics show cumulative count of Article Views (full-text article views including HTML views, PDF and ePub downloads, according to the available data) and Abstracts Views on Vision4Press platform.
Data correspond to usage on the plateform after 2015. The current usage metrics is available 48-96 hours after online publication and is updated daily on week days.
Initial download of the metrics may take a while.