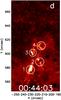
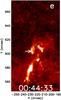
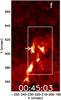
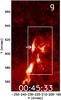
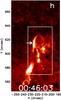
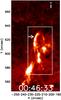
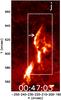
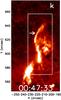
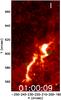
Fig. 4
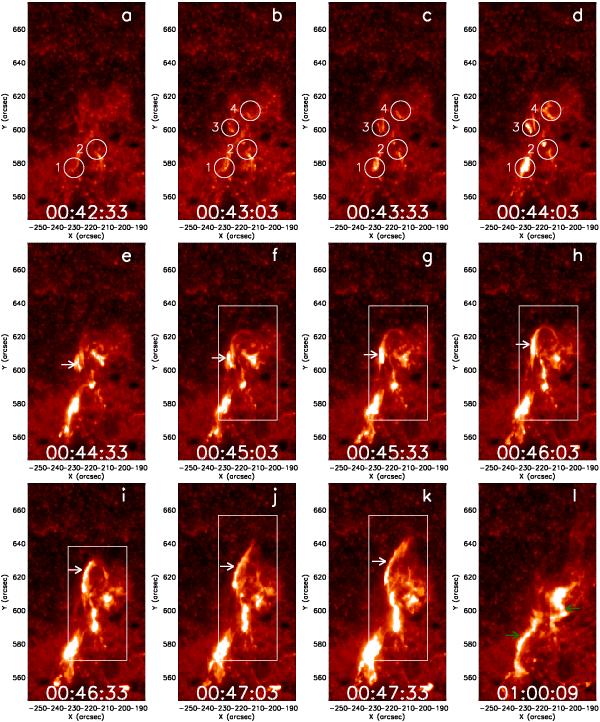
Evolution of the eruptive filament in TRACE 1600 Å channel from 00:42:33 UT to 01:00:09 UT on 2000 February 9. Panels a)–e) show the onset of the C6.6 flare and the appearance of the bright patches in the chromosphere. Panels f)–k) show the rising of the filament companying the C6.6 flare. The white circles in panels b)–d) indicate the locations of the brigh patches. The white boxes indicate the positions of the filament with time. The white arrows indicate the bright material that was drained by the filament gradually. Two green arrows indicate two flare ribbons. North is upward and west is to the right in all the images in this paper.
Current usage metrics show cumulative count of Article Views (full-text article views including HTML views, PDF and ePub downloads, according to the available data) and Abstracts Views on Vision4Press platform.
Data correspond to usage on the plateform after 2015. The current usage metrics is available 48-96 hours after online publication and is updated daily on week days.
Initial download of the metrics may take a while.