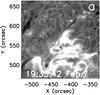
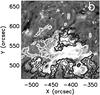
Fig. 3
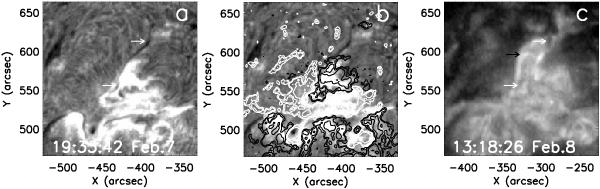
a) Hα image observed by BBSO at 19:33:42 UT on 2000 February 7. b) The Hα image observed by BBSO at 19:33:42 UT with the SOHO/MDI magnetograms at 19:11:30 UT superimposed on 2000 February 7. c) The 304 Å image observed by SOHO/EIT on 2000 February 8. The white arrows indicate the filament, while the black arrow indicates the bright loop.
Current usage metrics show cumulative count of Article Views (full-text article views including HTML views, PDF and ePub downloads, according to the available data) and Abstracts Views on Vision4Press platform.
Data correspond to usage on the plateform after 2015. The current usage metrics is available 48-96 hours after online publication and is updated daily on week days.
Initial download of the metrics may take a while.