Fig. 9
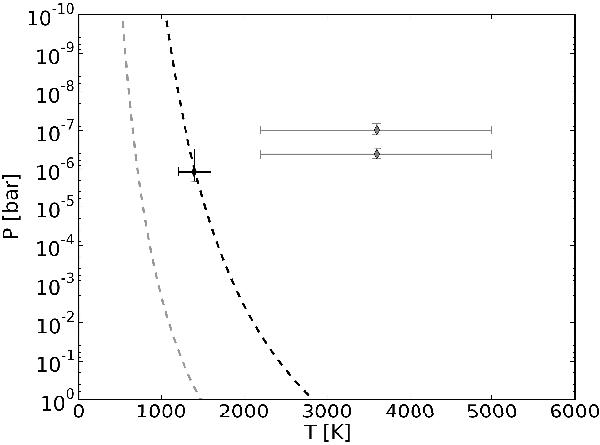
Vapour pressure curves are represented by dashed lines. The grey dashed line represents the calcium vapour pressure curve and the black dashed line represents the scandium vapour pressure curve. Grey and black dashed diamonds show the temperature and pressure conditions from the measured altitudes for calcium and candium, respectively.
Current usage metrics show cumulative count of Article Views (full-text article views including HTML views, PDF and ePub downloads, according to the available data) and Abstracts Views on Vision4Press platform.
Data correspond to usage on the plateform after 2015. The current usage metrics is available 48-96 hours after online publication and is updated daily on week days.
Initial download of the metrics may take a while.