Fig. 8
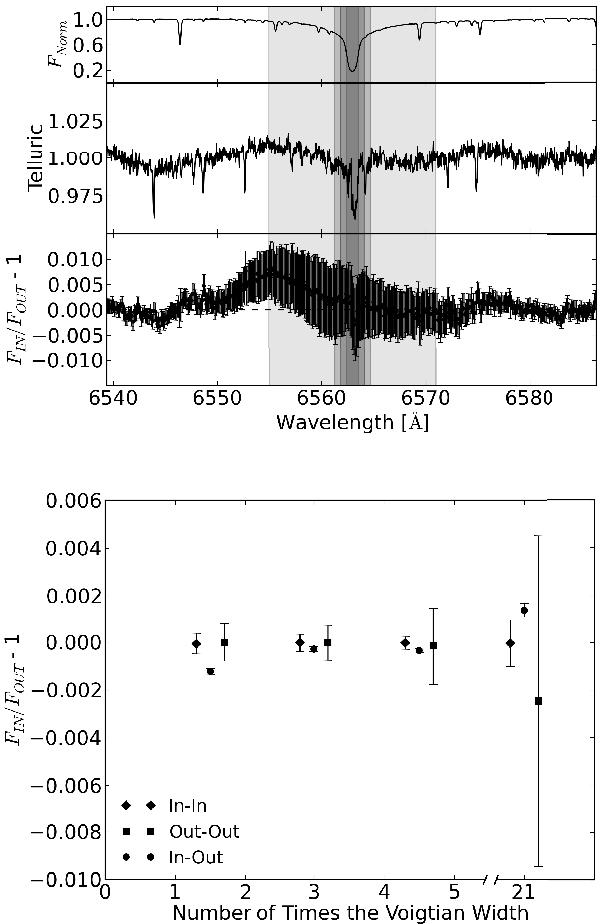
Top panel: from top to bottom, HD 209458 spectrum near Hα transition, our derived telluric spectrum, and the transmission spectrum. The selected pass-bands are ×1.5, ×3, ×4.5 the stellar line width, and the 16 Å pass-band used in Jensen et al. (2012). Bottom panel: transmitted signal measured in each used spectral window, including the ×21 (16 Å). This panel shows a possible detection of absorption excess due Hα in the narrower pass-band.
Current usage metrics show cumulative count of Article Views (full-text article views including HTML views, PDF and ePub downloads, according to the available data) and Abstracts Views on Vision4Press platform.
Data correspond to usage on the plateform after 2015. The current usage metrics is available 48-96 hours after online publication and is updated daily on week days.
Initial download of the metrics may take a while.