Fig. 7
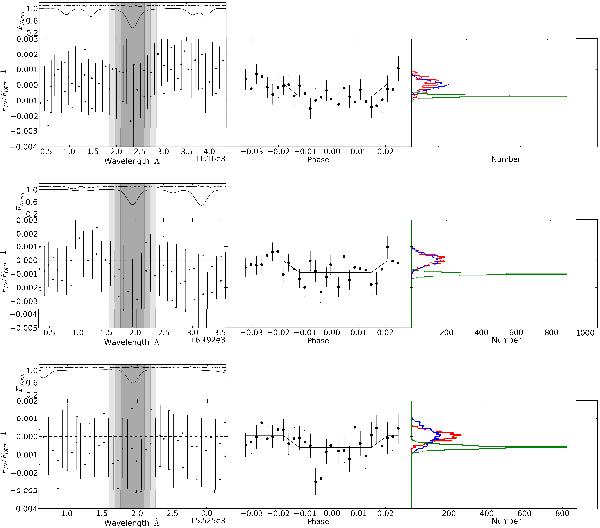
Analysis of the transitions of Ca I at 6162.27 Å, Ca I at 6493.8 Å. and Sc II at 5526.79 Å are shown in the first, second, and third row, respectively. Left panels: absorption excess in the binned transmission spectrum. For reference, the normalised stellar spectrum and the telluric spectrum (0.1 offset and 3 times magnified) are shown at the top of each panel. The shaded zones represent the pass-bands sizes. Middle panels: light curves derived from spectrophotometry using the ×4.5 band for both Ca I transitions and for Sc II. Flat light curves represent the averages of in-transit and out-of-transit data. Right panels: derived bootstrap distributions showing the detection stability: blue represents the in-in distribution, red the out-out distribution, and green is the in-out distribution.
Current usage metrics show cumulative count of Article Views (full-text article views including HTML views, PDF and ePub downloads, according to the available data) and Abstracts Views on Vision4Press platform.
Data correspond to usage on the plateform after 2015. The current usage metrics is available 48-96 hours after online publication and is updated daily on week days.
Initial download of the metrics may take a while.