Fig. 5
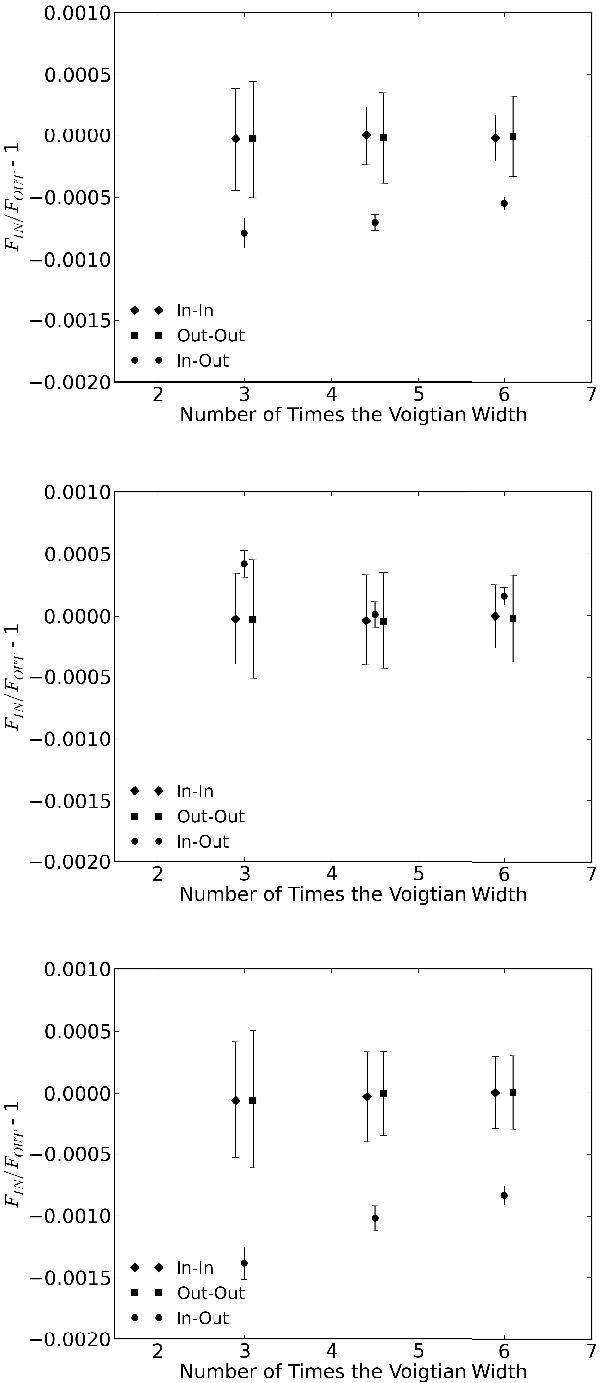
Transmitted signals of the Ca I transitions at 6162.27 Å (top panel), 6439.1 Å (middle panel), and 6493.78 Å (bottom panel) using pass-bands of ×3, ×4.5, and ×6 the stellar line width derived from fitting a Voigt profile. The significance of measurements were derived from the in-out scenario in the bootstrap analysis described in Sect. 2.3.1. The noise levels were derived from the in-in and out-out scenarios of the bootstrap analysis.
Current usage metrics show cumulative count of Article Views (full-text article views including HTML views, PDF and ePub downloads, according to the available data) and Abstracts Views on Vision4Press platform.
Data correspond to usage on the plateform after 2015. The current usage metrics is available 48-96 hours after online publication and is updated daily on week days.
Initial download of the metrics may take a while.