Fig. 4
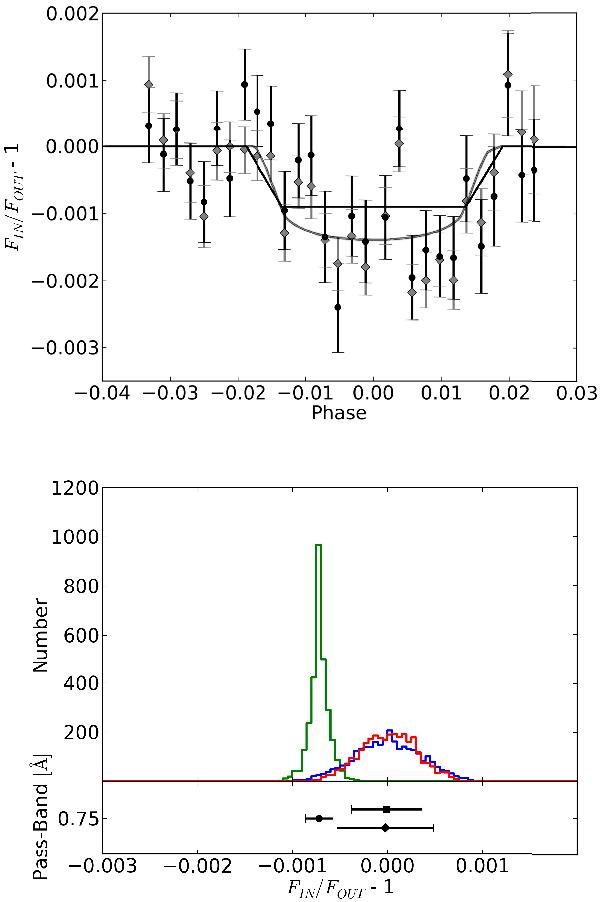
Comparison from Na I D with previous detection reported in this data set where the used pass-band was 0.75 Å. Top panel: transit photometry derived by S2008 (grey) and this work (black). The correction proposed by S2008 for CCD non-linearity was applied in this work. Solid lines represent the transit fits for this work (black) and S2008 (grey). The latter used a scaled version of HST photometry integrated over 582 and 638 nm which includes limb darkening contribution. Bottom panel: R2008 based analysis for the Na I D transmitted signal and its uncertainty derived from the bootstrap analysis. Green colour represent the in-out scenario, blue colour in-in scenario, and red colour the out-out scenario. The centre and 1σ of each distribution is shown at the bottom.
Current usage metrics show cumulative count of Article Views (full-text article views including HTML views, PDF and ePub downloads, according to the available data) and Abstracts Views on Vision4Press platform.
Data correspond to usage on the plateform after 2015. The current usage metrics is available 48-96 hours after online publication and is updated daily on week days.
Initial download of the metrics may take a while.