Fig. 2
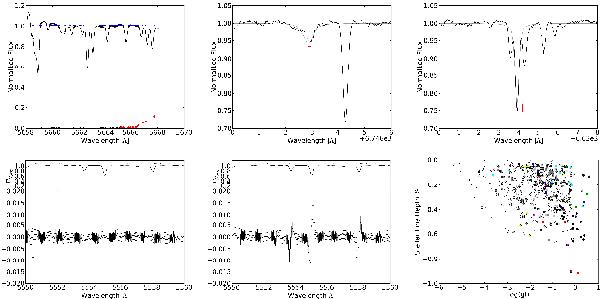
Top row: cases of transitions rejected by the selection criteria. From left to right: a crowded zone: black and blue points are pixels considered as continuum by the median filter and the median value, respectively. The sorted residuals are also plotted, where the 70% limit (black to red) is over 0.009. An asymmetrical blend: the red segments represents the wavelength difference. A symmetrical blend: the red segment shows the flux difference. Bottom row: the transmission spectrum without (left) and with (middle) the local shift correction. The stellar spectrum is shown at the top. Right: stellar line depths are generally stronger with greater oscillator strength values. Several species are plotted with different colours.
Current usage metrics show cumulative count of Article Views (full-text article views including HTML views, PDF and ePub downloads, according to the available data) and Abstracts Views on Vision4Press platform.
Data correspond to usage on the plateform after 2015. The current usage metrics is available 48-96 hours after online publication and is updated daily on week days.
Initial download of the metrics may take a while.