Fig. 7
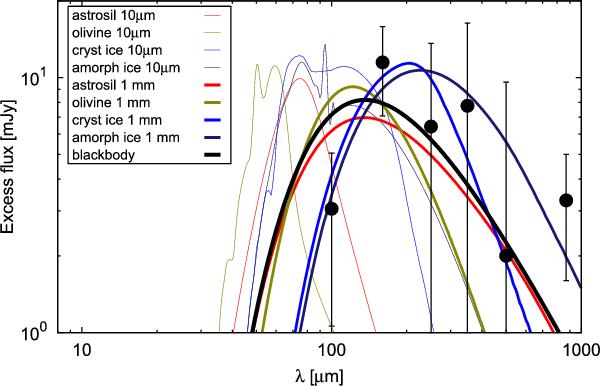
Excess emission from HIP 92043 plotted with the scaled emission profiles of various standard materials for two grain sizes, 10 μm and 1 mm, at a distance of 130 AU. Fluxes are photosphere and 70 μm dust component subtracted (as described in the text). Error bars on the measurements are 1-σ. It can be seen that the disc should be composed of large, icy (or low optical absorption) and cold grains.
Current usage metrics show cumulative count of Article Views (full-text article views including HTML views, PDF and ePub downloads, according to the available data) and Abstracts Views on Vision4Press platform.
Data correspond to usage on the plateform after 2015. The current usage metrics is available 48-96 hours after online publication and is updated daily on week days.
Initial download of the metrics may take a while.