Fig. 6
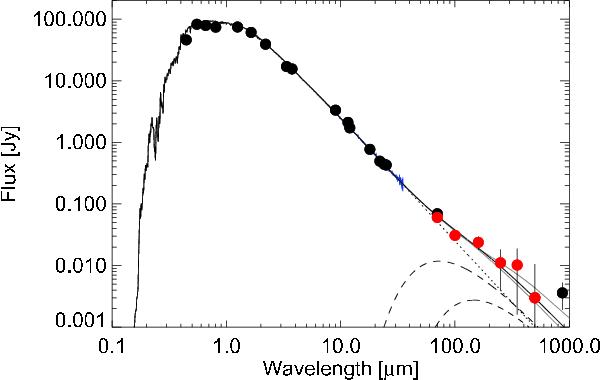
SED of HIP 92043. Optical, near infrared and LABOCA 870 μm point in black, the Spitzer IRS spectrum in blue, Herschel fluxes in red. Uncertainties are 1-σ and may be smaller than the data point. The stellar photosphere is denoted by a dotted line. The solid black line denotes the sum of the stellar photosphere and a pair of black bodies (70 and 30 K, dashed lines). The solid grey lines denote the effect on the SED of altering the cold component temperature by ±10 K.
Current usage metrics show cumulative count of Article Views (full-text article views including HTML views, PDF and ePub downloads, according to the available data) and Abstracts Views on Vision4Press platform.
Data correspond to usage on the plateform after 2015. The current usage metrics is available 48-96 hours after online publication and is updated daily on week days.
Initial download of the metrics may take a while.