Fig. 5
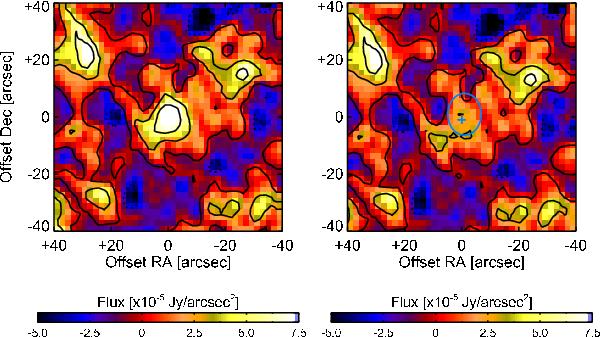
Herschel PACS 160 μm image of HIP 92043 as observed (left) and residual image (right) after subtraction of a point source scaled to the predicted source flux from the stellar optical position. Contours in both images are in 1-σ increments of sky noise from –2 to +4-σ (1-σ noise ~3.2 × 10⁻⁵ Jy/arcsec2). The light blue contour denotes the flux half-peak contour, as shown in Fig. 4. Image scale is 2′′ per pixel and orientation is N up, E left.
Current usage metrics show cumulative count of Article Views (full-text article views including HTML views, PDF and ePub downloads, according to the available data) and Abstracts Views on Vision4Press platform.
Data correspond to usage on the plateform after 2015. The current usage metrics is available 48-96 hours after online publication and is updated daily on week days.
Initial download of the metrics may take a while.