Fig. 3
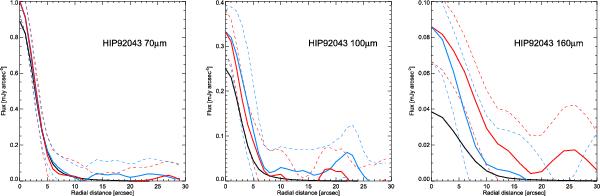
Radial profiles of HIP 92043 at 70, 100 and 160 μm (l–r), centred on the source peak at each wavelength. The solid red and blue lines represent the average radial profile of the target major and minor axes with their uncertainties denoted by the dashed red and blue lines. The solid black line represents the profile of the PSF model through the same orientation as the target major axis scaled to the predicted photosphere.
Current usage metrics show cumulative count of Article Views (full-text article views including HTML views, PDF and ePub downloads, according to the available data) and Abstracts Views on Vision4Press platform.
Data correspond to usage on the plateform after 2015. The current usage metrics is available 48-96 hours after online publication and is updated daily on week days.
Initial download of the metrics may take a while.