Free Access
Fig. 1
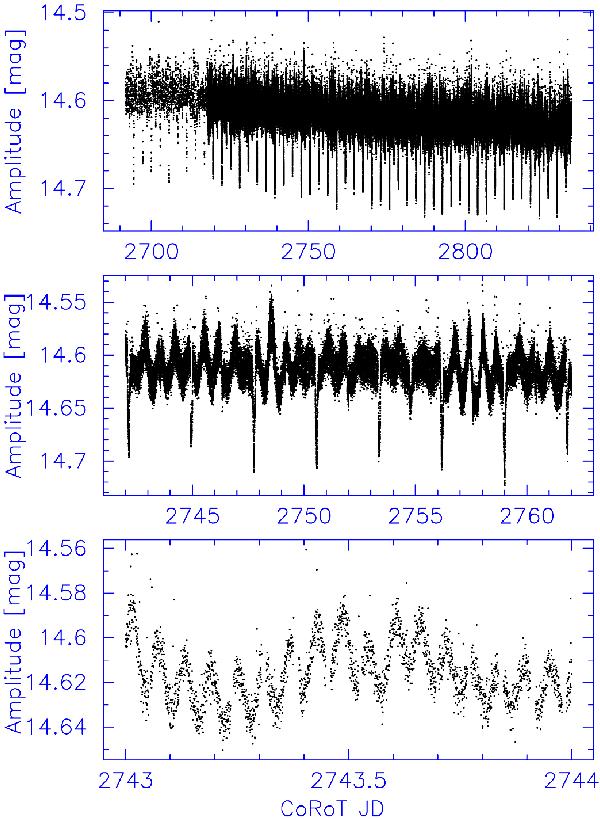
Light curve of the binary system 999 with different timescales. From top to bottom, the complete light curve over 142 d, then a subset over 22 d and finally a zoom into a 3.5 d subset. Eclipse phases are well determined. We note the different sampling: 512 s and 32 s.
Current usage metrics show cumulative count of Article Views (full-text article views including HTML views, PDF and ePub downloads, according to the available data) and Abstracts Views on Vision4Press platform.
Data correspond to usage on the plateform after 2015. The current usage metrics is available 48-96 hours after online publication and is updated daily on week days.
Initial download of the metrics may take a while.