Fig. 5
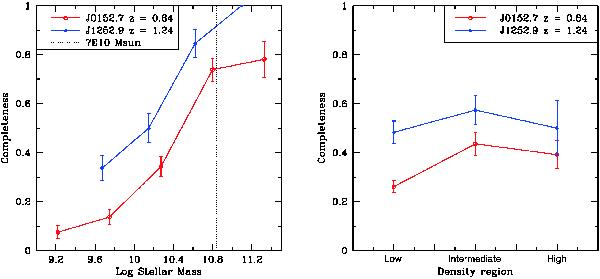
Spectroscopic completeness fractions as a function of stellar mass (left) and density region (right) for J0152.7 (red) and J1252.9 (blue). The horizontal dotted line in the left panel represents 7 × 10¹⁰M⊙, the dividing line between high-mass and low-mass samples. Completeness fractions for both clusters show a notable relationship to stellar mass but only a weak relationship to density. Uncertainties are determined using the bootstrap method resampled 10 000 times.
Current usage metrics show cumulative count of Article Views (full-text article views including HTML views, PDF and ePub downloads, according to the available data) and Abstracts Views on Vision4Press platform.
Data correspond to usage on the plateform after 2015. The current usage metrics is available 48-96 hours after online publication and is updated daily on week days.
Initial download of the metrics may take a while.