Fig. 2
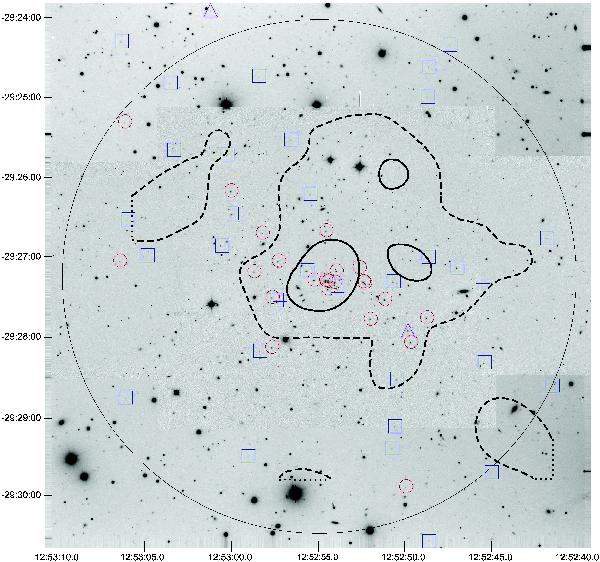
Distribution of 58 confirmed members of the galaxy cluster J1252.9 shown on a VLT FORS2 I-band + ISAAC K-band mosaic image. North is up and east is to the left. Blue squares are star-forming galaxies, red circles are passive galaxies, and purple triangles are X-ray sources. The image measures approximately 6.83 × 6.83 arcmin, or 3.41 × 3.41 proper Mpc at z = 1.24. The thin black circle represents the estimated virial radius of 1.61 Mpc from Demarco et al. (2007). Thick dashed and solid black lines represent boundaries of the intermediate and high density regions, respectively, as defined in Sect. 3.1. The dotted lines represent the edges of the Jee et al. (2011) weak-lensing map as encountered within an intermediate-density region.
Current usage metrics show cumulative count of Article Views (full-text article views including HTML views, PDF and ePub downloads, according to the available data) and Abstracts Views on Vision4Press platform.
Data correspond to usage on the plateform after 2015. The current usage metrics is available 48-96 hours after online publication and is updated daily on week days.
Initial download of the metrics may take a while.