Fig. 1
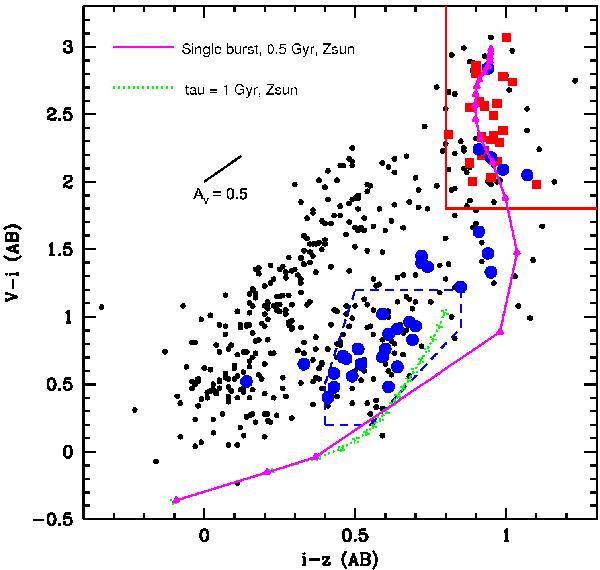
V − i vs. i − z color–color diagram of spectroscopically-targeted J1252.9 objects (from this paper and Demarco et al. 2007) and the color cuts used to select candidates for spectroscopic observation in this paper. The solid red box represents the color range for choosing red candidates, and the dashed blue polygon represents the color range for selection of blue candidates. Black dots represent nonmembers and unconfirmed objects. Red squares are confirmed passive members, and blue circles are confirmed star-forming members. Also shown are two Bruzual & Charlot (2003) galaxy evolution tracks at solar metallicity: a 0.5 Gyr single burst and a τ = 1 Gyr exponentially-declining star-formation model, at present-day ages ranging from 8.5 to 13 Gyr (formation redshift 1.22 to 9.84). The short black line corresponds to a reddening vector for Av = 0.5.
Current usage metrics show cumulative count of Article Views (full-text article views including HTML views, PDF and ePub downloads, according to the available data) and Abstracts Views on Vision4Press platform.
Data correspond to usage on the plateform after 2015. The current usage metrics is available 48-96 hours after online publication and is updated daily on week days.
Initial download of the metrics may take a while.